
Trading strategies often revolve around answering three fundamental questions: why, how, and what.
The «why» addresses the rationale behind considering a trading opportunity in a particular market. Leveraging PA analysis provides traders with an edge as they can anticipate the likely future direction of the market, whether it’s an upward or downward movement.
The «how» refers to the mechanics of your approach, which entails understanding the price levels for trade entry, setting stop-loss orders, and determining exit points.
When trading in forex accounts (https://fxprimus.com/accounts), these steps become essential for managing risks effectively. Ultimately, trading is probabilistic, highlighting the importance of protecting oneself and minimizing losses if the market moves unfavorably.
Lastly, the «what» constitutes the outcome of the trade. What do you aim to achieve? Is it short-term or long-term?
It all boils down to how you execute trades to generate profits and how you react if the outcome differs from your expectations.
Best Price Action Strategy #1: Hammer Pattern
The candlestick pattern Hammer is a bullish signal indicating a higher probability of upward market movement and is therefore primarily used in growing markets.
The Hammer indicates that sellers are pushing the market towards a new low. However, sellers are not strong enough to keep their positions open, so they start closing them. As a result, the market begins to rise, along with buyer activity.
- The opening and closing prices should be above the middle of the candle. Traditionally, the closing price may be lower than the opening price, but if the closing is higher, such a signal is considered stronger.
- Entry: the entry price can be the price level at which the next candle managed to break the high of the Hammer candle. If the maximum of the second Hammer candle, formed on a specific date, is x, then the entry into the trade can be made at the price level x+1.
- Stop Loss: the stop-loss level can correspond to the minimum of the Hammer pattern. If the market reaches the entry price but buyers do not initiate trades, it indicates that the price may need to decrease to find buyers. Therefore, it is advisable not to place the stop-loss too close to the entry level. Considering that the minimum of the Hammer candle is at the level of y, the stop-loss value can be set at the level of y-1.
- Target: there are several ways to close the trade with profit, for example, exit at the closing price of the candle if the trade is in profit, at a support or resistance level, or using a trailing stop.
- Trading: opening a position with a volume of 0.1 lot means that if this trade closes upon reaching the stop-loss level.
Best Price Action Strategy #2: Shooting Star Pattern
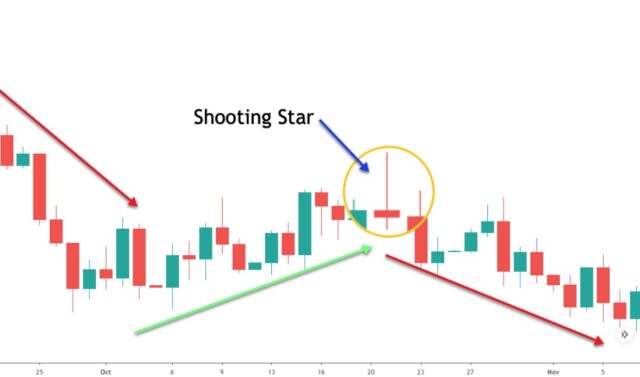
The Shooting Star pattern is a bearish signal indicating a higher probability of downward market movement and is primarily used in markets with a downtrend. Essentially, it is the opposite of the Hammer pattern.
The Shooting Star indicates that buyers are pushing the market towards a new high. However, buyers are not strong enough to keep their positions open, so they decide to close them.
As a result, the market falls, and sellers start opening short positions. The opening and closing prices should be in the lower half of the candle.
Traditionally, the closing price may be higher than the opening price, but if the closing is lower, such a signal is considered stronger.
- Entry: the entry price can be the price level at which the next candle managed to break the low of the Shooting Star candle. If the maximum of the third Shooting Star candle, formed on a specific date, is x, then the entry into the trade can be made at the price level x-1.
- Stop Loss: the stop-loss level can correspond to the maximum of the Shooting Star candle, which was established at the level of x, i.e., the stop-loss can be placed at the price of x+1.
- Target: there are several ways to close the transaction with profit: exit at the closing price of the candle if the trade is in profit, at a support or resistance level, or using a trailing stop.
- Trading: opening a position with a volume of 0.1 lot means that if this trade closes at the stop-loss.
Best Price Action Strategy #3: Harami (Reversal Price Action Patterns)
The Harami pattern is a trend reversal pattern consisting of two candles, indicating market indecision and primarily used for breakout trading. It can also be called an «inside candle» pattern as the candle forms within the range of the preceding candle.
A Bearish Harami is formed when the range between the high and low of the seller’s candle is within the range of the preceding buyer’s candle. Since a new high is not formed, the Bearish Harami indicates market indecision that may lead to a price decline.
A Bullish Harami is formed when the range between the high and low of the buyer’s candle is within the range of the preceding seller’s candle. Since a new low is not formed, the Bullish Harami indicates market indecision that may lead to a price increase.
So, how could you trade based on these patterns? There are many options, but unfortunately, there is no perfect one. Here are a few rules to consider:
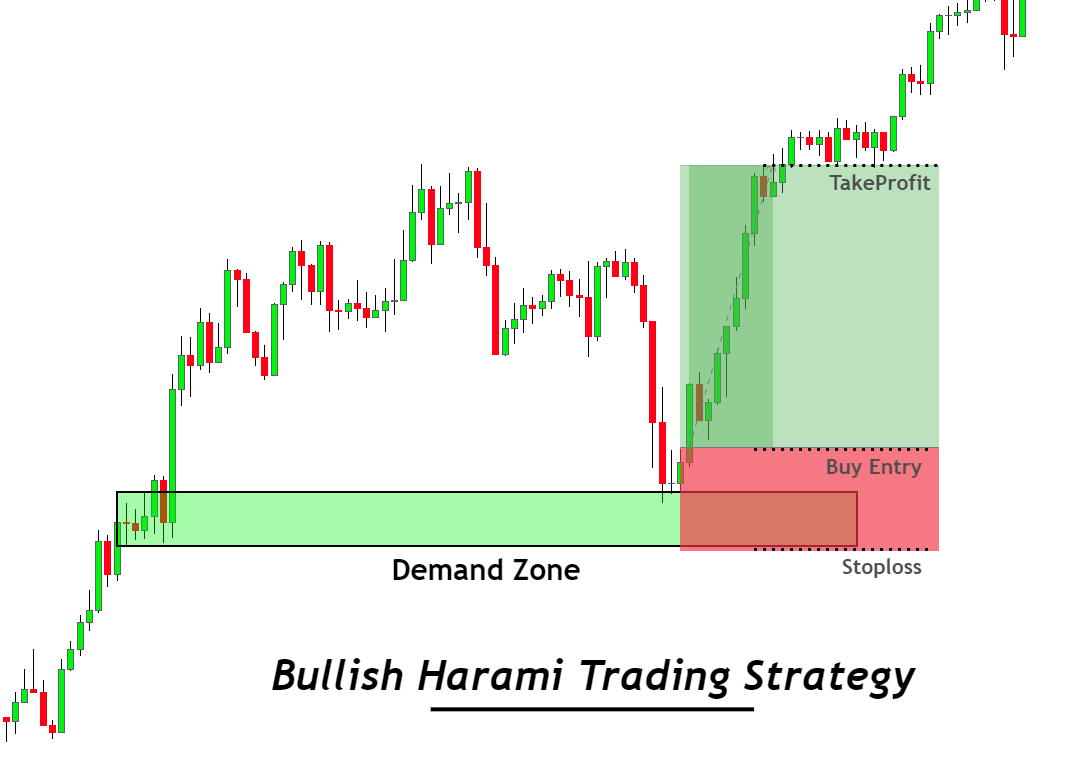
Best Price Action Patterns: Bullish Harami Trading
- Identify the Bullish Harami pattern.
- Open a trade one pip above the high of the last candle.
- Place a stop-loss one pip below the low of the previous candle.
- The risk/reward ratio should be 1:1, meaning your target level (=closing price of the trade) should be the same number of pips away from the opening price as the stop-loss but in the opposite direction.
Best Price Action Patterns: Bearish Harami Trading
- Identify the Bearish Harami pattern.
- Open a trade one pip below the low of the last candle.
- Place a stop-loss one pip above the high of the previous candle.
- The risk/reward ratio should be 1:1, meaning your target level (closing price of the trade) should be the same number of pips away from the opening price as the stop-loss but in the opposite direction.
If the trade was not opened at the opening price of the new candle, cancel the order. If the trade was opened, leave it in the market until the price reaches the stop-loss or target level.
Conclusion

In conclusion, the Forex Price Action strategies discussed offer valuable insights into market dynamics and potential trading opportunities.
The Hammer and Shooting Star patterns provide signals for bullish and bearish market movements, respectively, while the Harami pattern indicates trend reversals.
By understanding these patterns and adhering to the recommended entry, stop-loss, and target levels, traders can effectively manage their risk and capitalize on profitable trades.
It’s important to note that while these strategies provide a framework for decision-making, there is no one-size-fits-all approach to trading.
Each trader should adapt these strategies to suit their individual trading style, risk tolerance, and market conditions.
Moreover, consistent practice and ongoing learning are essential for mastering Price Action trading.
Wrapping Up
By continuously analyzing charts, refining trading strategies, and staying informed about market news and events, traders can enhance their skills and make more informed trading decisions.
Ultimately, Price Action trading offers a versatile and effective approach for both novice and experienced traders alike.
With patience, discipline, and a commitment to continuous improvement, traders can leverage Price Action strategies to navigate the complexities of the financial markets and achieve their trading goals.


